
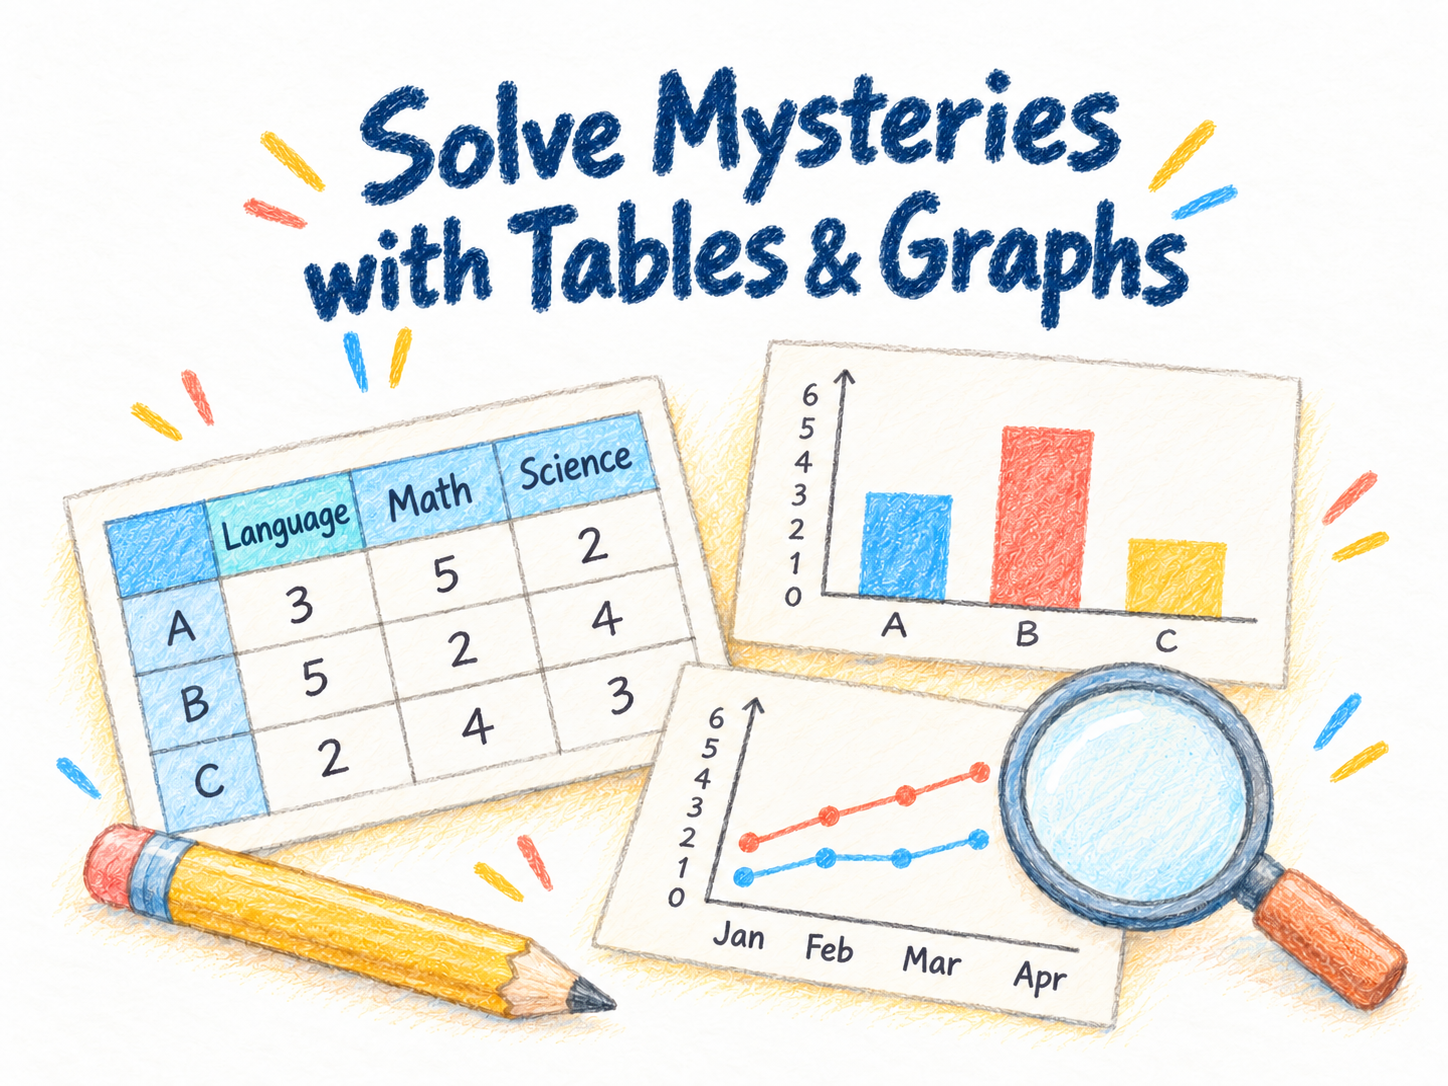
Count → Compare → Discover
What can numbers tell us?
Which group has the most? How much has it changed? Use tables and graphs as clues to solve little mysteries.
Which snack is the favorite?
In a snack survey, 3 people chose cookies, 5 chose jelly and 2 chose crackers. Each person adds the same amount to the height of a bar.
How many more people chose jelly than crackers?
See the answer and how to think about it
5 − 2 = 3. A difference of 3 people. Because the bars use the same scale, you can compare their heights. Can you also find how many people answered altogether?
Choose an activity to explore
The activity screens currently use Japanese. The first two buttons open English guides. The bar-graph and line-graph pages are in Japanese.

1. Count the Objects
Begin by matching each object with one count. Find out how many objects make up a group.

2. Tables and Picture Graphs
Arrange pictures to see which group has more or fewer. Sort, count and compare.

3. Tables and Bar Graphs
Which group has more? How much more? Look at the bars and the scale to find out.

4. Line Graphs
What changes over time? Follow the line between the points to find the pattern.
Open some reading tips
Tables: Use a table to check individual values. Read the headings to find out what each number describes.
Picture graphs: Compare amounts using pictures. Check how many objects or people each picture represents.
Bar graphs: Compare amounts in different groups. Check the value of each step on the scale and its unit.
Line graphs: Look for change over time. Check what the horizontal and vertical axes show.
Pie charts and percentage bars: Compare parts with a whole. First ask what the whole represents. These charts are introduced here as a next idea; there is no linked activity for them on this page.
Put your discovery into words
Can you say more than “the most”? Explain which group has more and by how much. Checking numbers and units also helps when you describe science observations or read information about the world.
About these activities
Start with counting, then explore tables, picture graphs, bar graphs or line graphs. You do not need to complete them in order. Choose something you would like to try.